I was analyzing the data (well, really I was just processing the data from the ugly text I can rip off the web into something that I can mangle with Excel) from the 2010 Peachtree City Sprint Triathlon and I found some interesting things.
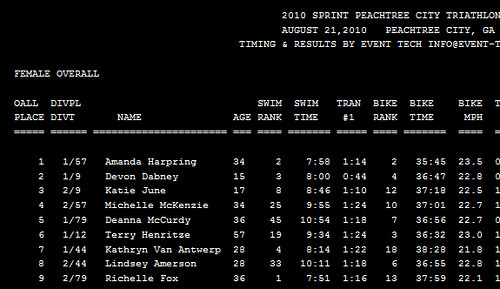
First off, all props to Event Tech for getting the results posted so quickly1 although it would be nice if I could pull the data down and actually use it with a bit less manual processing. Basically I have to import this…
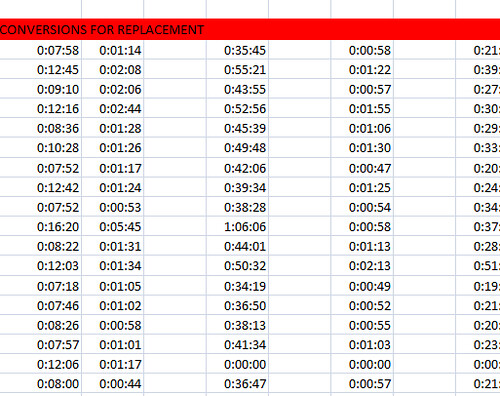
…into Excel and do a bunch of manual manipulation to end up with this…
…which for one allows me to sort by time and do various other things.
However, today I was doing something I hadn’t done before: I summed up the total of the swim/bike/run/T1/T2 times and compared it with the total time that Event Tech had calculated. Interestingly it was generally off. Off by one, two or three seconds.
Hmmm… fascinating.
Even more interesting is that it was rarely off by zero seconds.
I quickly realized that the total time was always equal to or less than the sum of the individual parts which implied to me that the total time was your chip time from the begin timing mat to the end timing mat and that the summation I had conducted was introducing rounding errors of some sort into the equation. After all, if you finish the swim in 10:00.4, your time on the sheet will say “10:00” but that 0.4 seconds still hangs on there and will contribute to your final time.
However, that doesn’t work. If you assume, as I did, that there are three splits that are introducing rounding errors (three because the maximum error was three seconds) it should be equally likely that the split will round down as up. That would mean there should have been instances where the split times added together were less than the total chip time. This, however, did not exist. Something was going on.
The next guess was that all splits were rounding up (three splits total). That would account for the sum of the splits being all greater than the total chip time. However, I ran a Monte Carlo simulation and got these results:
Bin – Frequency
0 – 21
1 – 438
2 – 464
3 – 21
Which is an expected distribution if everything is random however if you analyze the results from the race you get:
Bin – Frequency
0 – 11
1 – 266
2 – 496
3 – 159
This is markedly different from a random result. Something is biasing those numbers. The mean of the difference between the rounded times and the summed times for the Monte Carlo simulation is (as expected) approximately 1.5 but the mean of the race results is 1.8.
At this point I stopped. I could go on theorizing about why the numbers are off in the specific manner they are, but really it’s not that important.
What does this all mean? Absolutely nothing! As I mentioned above, your race results are your chip time from start to finish, it’s only when I started summing up their broken-out numbers that I noticed anything wonky and decided to geek out on this. I’m confident that my race time is accurate and even if it was not, it was only off by 1, 2 or 3 seconds. If those seconds make or break me, I should have trained harder!
I will probably send this link to Event Tech and ask if they have any insight; they probably do. It’s their software after all.
1: 2010 Tri PTC Results, although the white on black background thing should really go, guys. It’s tough on the eyeballs.


Leave a Reply